Friday, September 25, 2015

Warming Arctic Ocean Seafloor Threatens To Cause Huge Methane Eruptions

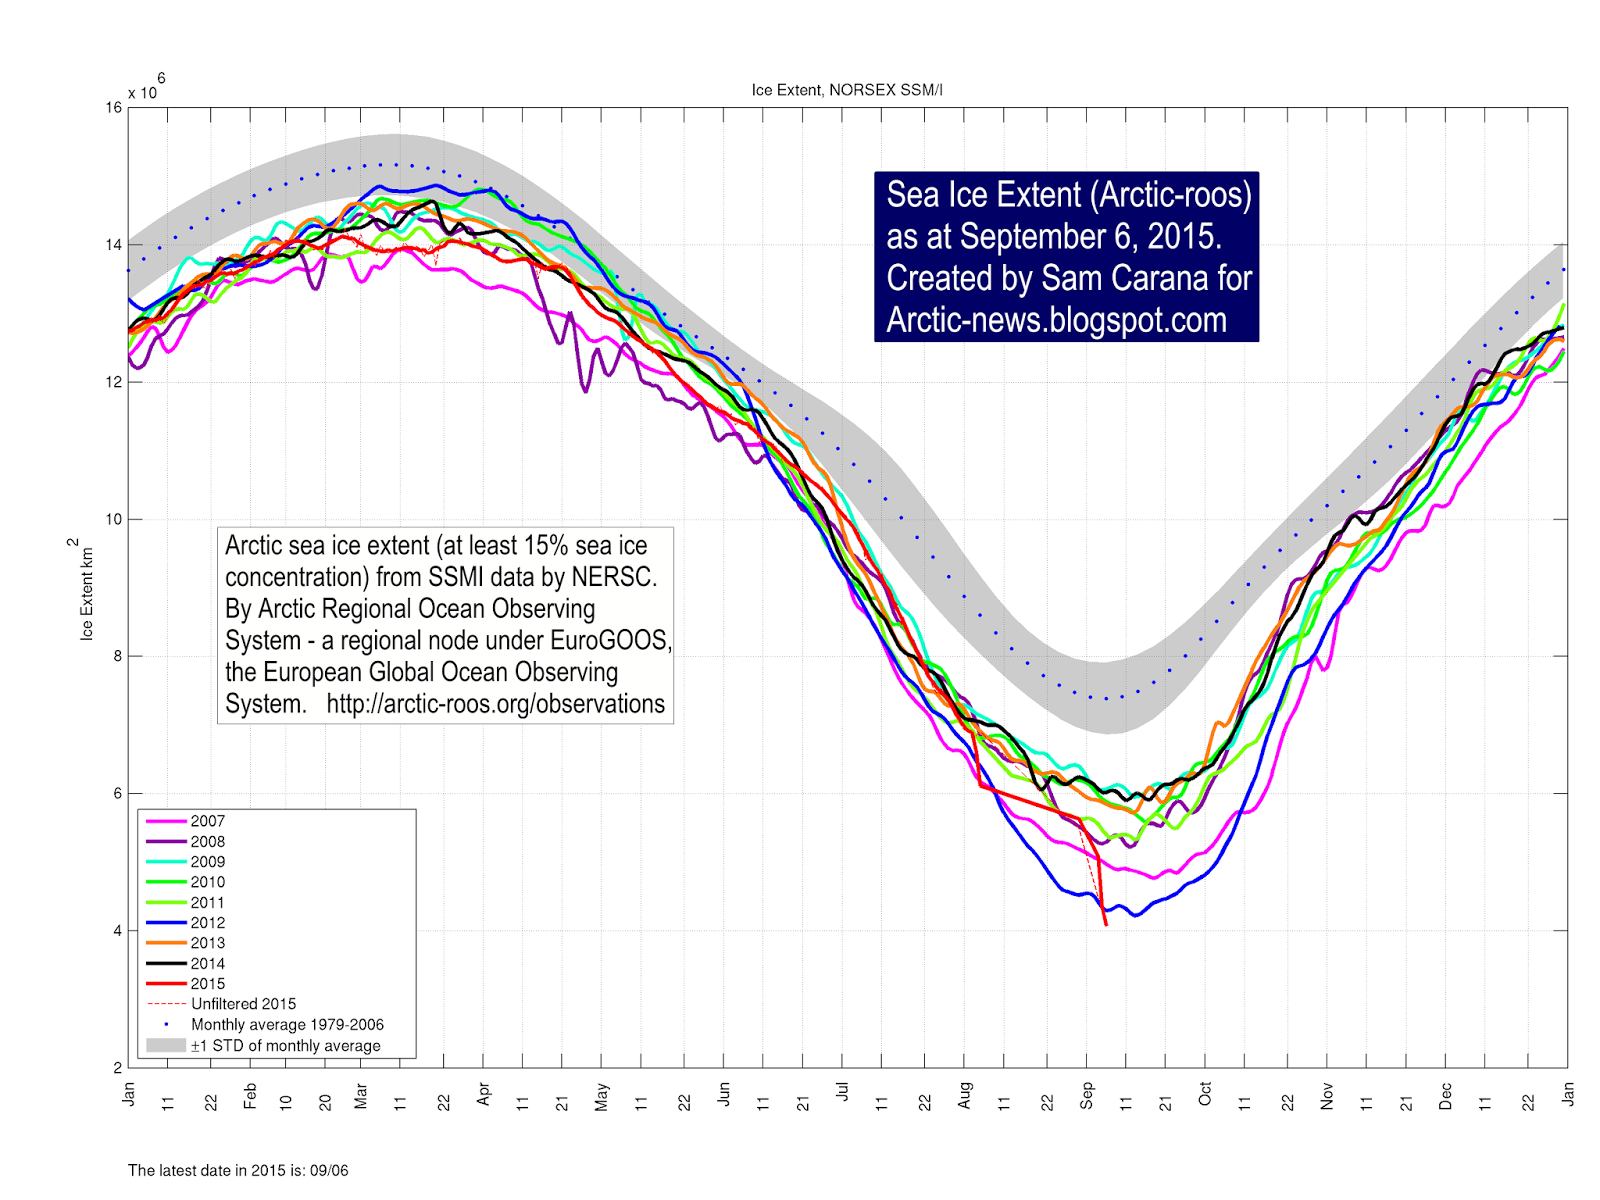
Rapidly growing 'Seal' over Arctic Ocean


Arctic sea ice extent and especially concentration are now growing rapidly, as illustrated by the Naval Research Lab animation on the right.

This means that the sea ice is effectively sealing off the water of the Arctic Ocean from the atmosphere, reducing the chances of transfer of ocean heat from the water to the atmosphere. Conversely, the risk grows that ocean heat will reach the seafloor.

Furthermore, this seal makes that less moisture evaporates from the water, which together with the change of seasons results in lower hydroxyl levels at the higher latitudes of the Northern Hemisphere, in turn resulting in less methane being broken down in the atmosphere over the Arctic.

Rising Ocean Heat


Water temperatures are very high in the Arctic. Above image shows Arctic sea surface temperature anomalies as at September 24, 2015. The risk of ocean heat reaching the Arctic Ocean seafloor has increased significantly over the years, due to rising ocean heat, as illustrated by the graph below, showing August sea surface temperature anomalies on the Northern Hemisphere over the years. 

[ from the earlier post: August 2015 Had Highest Sea Surface Temperature on Record ]
Ocean heat is increasing because people's emissions are making the planet warmer and more than 93% of the extra heat goes into the oceans.

Ocean temperatures have been measured for a long time. Reliable records go back to at least 1880. Ever since records began, the oceans were colder than they are now. Back in history, there may have been higher temperature peaks - the last time when it was warmer than today, during the Eemian Period, peak temperature was a few tenths of a degree higher than today. In many ways, however, the situation now already looks worse than it was in the Eemian. "The warm Atlantic surface current was weaker in the high latitude during the Eemian than today", says Henning Bauch. Furthermore, carbon dioxide levels during the Eemian were well under 300 ppm. So, there could well have been more pronounced seasonal differences then, i.e. colder winters that made that the average ocean temperature didn't rise very much, despite high air temperature in summer. By contrast, today's high greenhouse levels make Earth look set for a strong ocean temperature rise.

And indeed, this is illustrated by above image, showing a polynomial trendline that points at a rise of almost 2°C by 2030. This trendline is contained in ocean temperature data from 1880 for the August Northern Hemisphere sea surface temperature anomalies.

Cold Freshwater 'Lid' on North Atlantic


Note that the above ocean temperature graph and the above video only show sea surface temperatures. Underneath the surface, water can be even warmer. The Gulf Stream reaches its maximum temperatures off the North American coast in July. It can take some four months for this heat to travel along the Gulf Coast and reach destinations farther in the Arctic Ocean. Water warmed up off Florida in July may only reach waters beyond Svalbard by October or November.

The image below shows that on August 22, 2015, at a location near Florida marked by the green circle, sea surface temperatures were as high as 33.4°C (92.1°F), an anomaly of 3.8°C (6.8°F).


The image below shows sea surface temperatures on August 22, 2015, as an indication of the huge amount of ocean heat has accumulated in the Atlantic Ocean off the coast of North America.


The huge amounts of energy entering the oceans translate into higher temperatures of the water and of the air over the water, as well as higher waves and stronger winds.

Ocean heat carried by the Gulf Stream from Florida via the North Atlantic into the Arctic Ocean.
The image on the left shows that on August 25, 2015, sea surface temperatures near Svalbard were recorded as high as 17.3°C (63.1°F), as marked by the green circle, a 12.1°C (21.8°F) anomaly.

This indicates that ocean heat did reach that location from underneath the sea surface. In other words, subsurface temperatures of the water carried along by the Gulf Stream can be substantially higher than temperatures of the water at the surface, and this can be the case for the water all the way from the coast of North America to the Arctic Ocean.

The Gulf Stream keeps pushing much of this very warm water north, into the Arctic Ocean, where it threatens to unleash huge methane eruptions from the Arctic Ocean seafloor.

The combination image below shows the Gulf stream carrying warm water from the coast of North America into the Arctic Ocean on September 12, 2015, and sea surface reaching temperatures as high as 14.6°C (58.3°F) that day at a location near Svalbard (marked by green circle), an 9.8°C (17.6°F) anomaly

[ click on image to enlarge ]
The combination image below shows that sea surface temperature anomalies still are very high. The left panel shows that anomalies on September 25, 2015 were as high as +6°C (+10.8°F) in the North Atlantic (location marked by green circle), compared to 1901-2011. The right panel shows anomalies on September 26, 2015, in the North Atlantic of +0.81°C (+1.46°F) and in the North Pacific of +1.02°C (+1.84°F), compared to 1971-2000.


Below is an update on the situation. On October 5, 2015, sea surface temperature anomalies were as high as 6.4°C, 7.4°C and 7.3°C (11.5°F 13.2°F and 13.1°F) off the North American coast, and as high as 9.4°C (16.8°F) near Svalbard.


Speed of surface water was as high as 1.6 m/s (3.6 mph) on October 5, 2015. This wasn't as high as some of the speeds reached earlier in the year (a speed of 2.16 m/s or 4.7 mph was recorded on August 15, 2015), but it does indicate how strong the Gulf Stream still is at this time of year. Water speed slows down as the Gulf Stream progresses toward the Arctic Ocean. While speeds as high as 0.22 m/s and 0.24 m/s (0.5 mph) were recorded near Svalbard and Norway, overall speed was a lot lower in this part of the Atlantic.

What is making the situation worse is depicted in the images below. From 2012, huge amounts of freshwater have run off Greenland, with the accumulated freshwater now covering a huge part of the North Atlantic, as illustrated by the image below. 


Since it's freshwater that is now covering a large part of the surface of the North Atlantic, it will not easily sink in the very salty water that was already there. The water in the North Atlantic was very salty due to the high evaporation, which was in turn due to high temperatures and strong winds and currents. As said, freshwater tends to stay on top of more salty water, even though the temperature of the freshwater is low, which makes this water more dense. The result of this stratification is less evaporation in the North Atlantic, and less transfer of ocean heat to the atmosphere, and thus lower air temperatures than would have been the case without this colder surface water.


As meltwater accumulates at the surface of the North Atlantic, will it slow down the Gulf Stream?

More elongated curves and eddies forming where the meltwater meets the Gulf Stream appears to make that it will indeed take longer for surface water to travel from the coast of North America to the Arctic Ocean. However, the speed reached within such eddies may actually be higher. After all, the amount of extra heat that enters the oceans keeps growing and this extra energy will likely translate into warmer water carried in greater volumes and at higher speed by the Gulf Stream underneath the surface of the North Atlantic into the Arctic Ocean, be it that the more curved patterns of the currents will increase the overall time it takes for water to travel the distance, especially at the surface.

Importantly, as global warming continues to heat up the oceans, the accumulated freshwater at the surface of the North Atlantic makes that less ocean heat can be transferred from the water to the atmosphere there, i.e. the freshwater is acting like a lid. Similarly, the Arctic sea ice is acting as a seal over the Arctic Ocean, as seasons change. In conclusion, the highest temperatures of the water of the Arctic Ocean, especially at greater depth, are yet to be reached this year.


Above image illustrates that, while Arctic sea water at the surface reaches its highest temperatures in the months from July to September, water at greater depth reaches its highest temperatures only in October through to the subsequent months.

Methane Eruptions from Arctic Ocean Seafloor

In the Arctic Ocean, this more salty newly-arriving warm water will tend to dive under the freshwater that has formed from the melting of sea ice over the past few months. The danger is thus that warmer water will be pushed into the Arctic Ocean at lower depth, and that it will reach the seafloor of the Arctic Ocean.

Huge amounts of methane are contained in sediments on the Arctic Ocean seafloor. Ice acts like a glue, holding these sediments together and preventing destabilization of methane hydrates. 

Pingos and conduits. Hovland et al. (2006)
Warmer water reaching these sediments can penetrate them by traveling down cracks and fractures in the sediments, and reach the hydrates. The image on the right, from a study by Hovland et al., shows that hydrates can exist at the end of conduits in the sediment, formed when methane did escape from such hydrates in the past. Heat can travel down such conduits relatively fast, warming up the hydrates and destabilizing them in the process, which can result in huge abrupt releases of methane.

Heat can penetrate cracks and conduits in the seafloor, destabilizing methane held in hydrates and in the form of free gas in the sediments.

Elsewhere, methane hydrates will typically be located at great depth, making it more difficult for ocean heat to reach them. In the Arctic, much of the water is very shallow. The East Siberian Arctic Shelf (ESAS) is on average only 50 m deep, making it easier for heat to reach the seafloor and also making that methane that escapes will have to travel through less water, reducing the chances that methane will be broken down by microbes on the way up through the water. Furthermore, hydroxyl levels are very low over the Arctic, making that the methane will not quickly be broken down in the atmosphere over the Arctic either.

The big melt in Greenland and the Arctic in general is causing further problems. Isostatic adjustment following melting can contribute to seismic events such as earthquakes, shockwaves and landslides that can destabilize methane hydrates contained in sediments on the Arctic Ocean seafloor.


Above image shows methane levels as high as 2554 parts per billion, on the morning of September 23, 2015, in the bottom panel, and strong methane releases over the ESAS, as indicated by the solid magenta-colored areas in the top panel, on the afternoon of the previous day at lower altitude. These are indications of methane releases from the seafloor of the Arctic Ocean. Strong winds over the ESAS, as the image below shows, may have contributed, by mixing warm water down to the seafloor.


On the morning of September 25, 2015, methane reached levels as high as 2629 ppb, while mean global level reached a record high 1846 ppb. The video below, created with Climate Reanalyzer images,  shows strong winds over the Arctic for the period September 26 to October 3, 2015.


The video below, created by Cameron Forge with Climate Reanalyzer images, shows Arctic air temperature anomalies end September - early October, 2015.


Air Temperature Rise

NOAA data show that the year-to-date land surface temperature in July was 1.47°C above the 20thcentury average on the Northern Hemisphere in 2015. A polynomial trendline based on these data points at yet another degree Celsius rise by 2030, on top of the current level, which could make it 3.27°C warmer than in 1750 for most people on Earth by the year 2030, as illustrated by the image below.

Will it be 3.27°C warmer by the year 2030?
The image below shows a non-linear trend that is contained in the temperature data that NASA has gathered over the years, as described in an earlier post. A polynomial trendline points at global temperature anomalies of over 4°C by 2060. Even worse, a polynomial trend for the Arctic shows temperature anomalies of over 4°C by 2020, 6°C by 2030 and 15°C by 2050, threatening to cause major feedbacks to kick in, including albedo changes and methane releases that will trigger runaway global warming that looks set to eventually catch up with accelerated warming in the Arctic and result in global temperature anomalies of 16°C by 2052.
[ click on image to enlarge ]
The situation is dire and calls for comprehensive and effective action, as discussed at the Climate Plan.


In the Arctic Ocean, the more salty newly-arriving warm water will tend to dive under the freshwater that has formed...
Posted by Sam Carana on Friday, September 25, 2015

Tuesday, September 22, 2015

Arctic Sea Ice 2015 - Update 10

It looks like sea ice has passed its minimum extent for the year 2015, as illustrated by the image below.


There are some differences between the various websites measuring extent, such as to whether the 2015 low was the third or fourth lowest. Japanese measurements show that sea ice extent was 4.26 million square km on September 14, 2015, i.e. lower than the 2011 minimum of 4.27 million square km, as illustrated by the image below.


Meanwhile, the Polar Science Center at the University of Washington has announced that Arctic sea ice volume minimum was reached on September 12, 2015, with a total volume of 5,670 cubic km. The image below shows a polynomial trendline based on their annual Arctic sea ice volume minima, including this volume for 2015.


Importantly, the sea ice in many places is now less thick than it was in 2012, as illustrated by the image below, showing sea ice thickness on September 27, 2012 (panel left) and a forecast for September 27, 2015 (panel right).


The reason for the dramatic decrease in thickness of the multi-year sea ice is ocean heat, as illustrated by the image below, showing sea surface temperature anomalies in the Arctic as at September 21, 2015.


The water of the Arctic Ocean is very warm, not only at the surface, but even more so underneath the surface. What has contributed to this situation is described by the image below. From 2012, huge amounts of fresh water have run off Greenland, with the accumulated fresh water now covering a huge part of the North Atlantic.

Since it's fresh water that is now covering a large part of the surface of the North Atlantic, it will not easily sink in the very salty water that was already there. The water in the North Atlantic was very salty due to the high evaporation, which was in turn due to high temperatures and strong winds and currents. As said, fresh water tends to stay on top of more salty water, even though the temperature of the fresh water is low, which makes this water more dense. The result of this stratification is less evaporation in the North Atlantic, and less transfer of ocean heat to the atmosphere, and thus lower air temperatures than would have been the case without this colder surface water.


Meanwhile, global warming continues to heat up the oceans, while less of this ocean heat can now be transferred from the water to the atmosphere in the North Atlantic, since the fresh water is acting like a lid.

The danger is thus that warmer water will be pushed into the Arctic Ocean at lower depth, and that it will reach the seafloor of the Arctic Ocean where huge amounts of methane are contained in sediments. Ice acts like a glue, holding these sediments together and preventing destabilization of methane hydrates. Warmer water reaching these sediments can penetrate them by traveling down cracks and fractures in the sediments, and reach the hydrates.

The big melt in Greenland and the Arctic in general is causing further problems. Isostatic adjustment following melting can contribute to seismic events such as earthquakes, shockwaves and landslides that can destabilize methane hydrates contained in sediments on the Arctic Ocean seafloor.

In the video below, by Nick Breeze, Professor Peter Wadhams discusses the situation.


The situation is dire and calls for comprehensive and effective action as discussed at the Climate Plan.


The water of the Arctic Ocean is very warm, not only at the surface, but even more so underneath the surface. What has...
Posted by Sam Carana on Tuesday, September 22, 2015

Sunday, September 20, 2015

August 2015 Had Highest Sea Surface Temperature on Record

Across the oceans, the August 2015 globally-averaged sea surface temperature was 0.78°C (1.40°F) above the 20th century average—the highest temperature for any month in the 1880–2015 record. NOAA analysis further shows that in August 2015, the sea surface on the Northern Hemisphere was 1.02°C (1.84°F) warmer than it was in the 20th century, as illustrated by the graph below.


As the image below shows, the August data for sea surface temperature anomalies on the Northern Hemisphere contain a trendline pointing at a rise of 2°C (3.6°F) well before the year 2030. In other words, if this trend continues, the Northern Hemisphere sea surface will be 2°C (3.6°F) warmer in about a dozen years time from now.


Such a temperature rise would be catastrophic, as there are huge amounts of methane contained in the form of hydrates and free gas in sediments under the Arctic Ocean seafloor. A relatively small temperature rise of part of these sediments could cause a huge abrupt methane eruption, further speeding up local warming and triggering further methane eruptions, in a spiral of runaway warming that will cause mass destruction and extinction, as described in the reference page The Mechanism.

The situation is dire and calls for comprehensive and effective action, as discussed at the Climate Plan page.


August data for sea surface temperature anomalies on the Northern Hemisphere contain a trendline pointing at a rise of 2...

Posted by Sam Carana on Sunday, September 20, 2015

Friday, September 18, 2015

Arctic Sea Ice Collapse Threatens - Update 9

The image below shows that Arctic sea ice had reached a level of 4.45 million square kilometers on September 16, 2015 (end of dark blue line at center of image).


NSIDC has meanwhile called the 2015 minimum, but the first sentence of their post hastens to add that on September 11, Arctic sea ice reached its likely minimum for 2015,  at 4.41 million square kilometers (1.70 million square miles), putting 2015 in the fourth lowest place since satellite records began. Arctic sea ice minimum was lower only in 2012 (dotted line), 2007 (light blue line) and 2011 (orange line). Sea ice extent was 4.413 million square kilometers both on September 9, 2015, as well as on September 10 and 11, 2015.

September 9 would be early for the sea ice to reach its minimum, as a comparison with earlier years on above image illustrates. The dark blue line on above image shows that sea ice extent fell slightly on September 16, compared to the day before, and is now below the 2011 extent (orange line) for this time of the year. Over the next few days, sea ice extent may well fall somewhat further, and reach a level below the 2011 minimum, thus reaching the third lowest minimum extent since record began. This could eventuate due to winds compacting the sea ice.

More importantly, sea ice thickness is still falling, as illustrated by the image below showing the sea ice thickness on September 9 in the left panel and a forecast for thickness on September 24 in the right panel.


The image below compares sea ice thickness between September 24, 2012 (left panel) with that forecast for September 24, 2015 (right panel).


Above image illustrates why the situation in 2015 is even more threatening than it was in 2012. Only the ice that is colored light green, yellow and red is more than 3 meters thick. In 2015, ocean heat has been melting the sea ice from underneath. So, even while the currently lower temperatures of the air may have resulted in a slight increase in extent over the past week, the added ice is very thin. Ocean heat first of all goes into melting the thickest sea ice, i.e. the parts that are meters below the surface. This because the water at surface level is colder than the water underneath the surface. This explains why much of the water surface will remain covered by (very thin) ice as air temperatures are now falling (compared to air temperatures over the past few months).

The image below shows sea surface temperatures as at September 17, 2015.


In conclusion, while the sea ice appears to have survived the 2015 melting season without collapsing, the threat that this will occur in the coming years is ominous. Lack of multi-year sea ice makes that sea ice is in a very vulnerable situation. Total collapse of sea ice is therefore more likely to happen in the coming years. Every time ocean heat will arrive in the Arctic Ocean at its fullest strength in future, this heat will no longer be able to be fully absorbed by the process of melting thick sea ice, so what's left of the sea ice will melt very quickly.

There is a strengthening El Niño, while more open water increases the chance that storms will develop that will push the last remnants of the sea ice out of the Arctic Ocean, as discussed in earlier posts such as this one. Storms can also mix warm surface waters all the way down to the seafloor, as discussed in this earlier post. Cyclones that emerge with greater force due to high sea surface temperatures further increase this danger.

The big danger is that ocean heat will cause methane contained in sediments on the Arctic Ocean seafloor to be released abruptly in large quantities, triggering further methane releases spiraling into runaway warming.

The situation is dire and calls for comprehensive and effective action, as discussed in the Climate Plan.


Below is a text-only version of this post for radio.


Sea ice thickness on September 24, 2012 (left panel) compared to a forecast for September 24, 2015 (right panel). This...
Posted by Sam Carana on Friday, September 18, 2015

Thursday, September 10, 2015

3.27°C warmer by 2030?

Will it be 3.27°C warmer by the year 2030?
In December 2015, world delegates will descend on Paris to ensure that global warming will not cross the guardrail of 2°C above pre-industrial levels.

[ click on images to enlarge them ]
In a way, we have already crossed this guardrail. NOAA data show that the year-to-date land surface temperature was 1.47°C above the 20th century average on the Northern Hemisphere in 2015, as illustrated by the image on the right.

Granted, there was less warming on the Southern Hemisphere, so the globally-averaged land surface temperature was a little bit lower, i.e. 1.34°C above the 20th century average. For reference, the image below on the right gives an overview of mean 1901-2000 temperatures. Anyway, the difference between hemispheres is small and not very relevant since most people live on the Northern Hemisphere.

[ click on image to enlarge ]
More importantly, this 1.47°C rise is a rise compared to the 20th century average. The 20th century average was some 0.60°C higher than temperatures were at the start of the NOAA record in 1880. In other words, temperatures for most people on Earth are already 2.07°C higher than they were in 1880.

Furthermore, between 1750 and 1880 the global average temperature had already increased by some 0.20°C.

Sure, 2015 is an El Niño year, but this El Niño is still strengthening, so 2016 could well be even warmer. Moreover, recent temperatures are in line with expectations of a polynomial trendline that is based on these NOAA data and that points at yet another degree Celsius rise by 2030, on top of the current level, as illustrated by the top image. Altogether, this would make it 3.27°C warmer than in 1750 for most people on Earth by the year 2030.

So, instead of acting as if dangerous global warming could possibly eventuate beyond the year 2100, delegates in Paris should commit to lowering temperatures, starting now.

To lower temperatures, cutting emissions alone will not be enough.

Stopping all emissions by people would make that the aerosols that are currently sent up in the air by burning fuel and that are currently masking the full impact of global warming, will fall out of the air in a matter of weeks. Until now, about half of the global temperature rise is suppressed by such aerosols. Stopping aerosols release overnight could make temperatures rise abruptly by 1.20°C in a matter of weeks.

Furthermore, carbon dioxide that is emitted now will take ten years to reach its peak impact, so we're still awaiting the full wrath of carbon dioxide emitted over the past decade.

A recent study calculates that global mean surface temperature may increase by 0.50°C after carbon emissions are stopped, and they will decrease only minimally from that level for the next 10,000 years.

Removing carbon dioxide from the atmosphere would not work fast enough to avoid further warming and acidification of the oceans. In fact, temperatures look set to rise even faster as feedbacks start to kick in more fully, such as albedo changes due to decline of the snow and ice cover in the Arctic and methane releases from the Arctic Ocean seafloor. Furthermore, water vapor will increase by 7% for every 1°C warming. Water vapor is one of the strongest greenhouse gases, so increasing water vapor will further contribute to a non-linear temperature rise.

In conclusion, the world needs to commit to comprehensive and effective action that includes both emission cuts and removal of greenhouse gases from the atmosphere and oceans, as well as further action to deal with the dire situation in the Arctic, as discussed at the Arctic-news Blog.


In December 2015, world delegates will descend on Paris to ensure that global warming will not cross the guardrail of 2°...
Posted by Sam Carana on Thursday, September 10, 2015

Monday, September 7, 2015

Arctic Sea Ice Collapse Threatens - Update 8

The image below, from Arctic-roos.org, shows Arctic sea ice extent up to September 6, 2015.
Editorial note: The dramatic drop in sea ice extent shown on the image below turns out to be an error. The website at Arctic-roos.org is being updated and will show the correct extent soon.
The image shows a recent drop in sea ice extent that is so dramatic (red line, i.e. extent for the year 2015) that some think that it must be a glitch in the system. Even so, it should act as a warning about deterioration of the sea ice in the Arctic.

As discussed in earlier posts, the sea ice today is in a terrible condition. Thick sea ice is virtually absent compared to the situation in the year 2012 around this time of year, as illustrated by the image below that compares sea ice thickness on September 5, 2012 (left panel) with September 5, 2015 (right panel).


Furthermore, sea surface temperatures are very high. The North Pacific, on September 3, 2015, was more than 1°C (1.8°F) warmer than it was compared to the period from 1971 to 2000, as illustrated by the Climate Reanalyzer image on the right.

Sea surface temperature are very high around North America, both in the Pacific Ocean and in the Atlantic Ocean. The image below shows sea surface temperatures on September 4, 2015, indicating that a huge amount of ocean heat has accumulated in the Atlantic Ocean off the coast of North America.

The Gulf Stream is pushing much of this warm water toward the Arctic Ocean. Additionally, warm water from the Pacific Ocean is entering the Arctic Ocean through the Bering Strait.


Above image below shows sea surface temperature anomalies in the Arctic as at September 6, 2015. 

As the Arctic warms up faster than the rest of the world, the jet stream becomes ever more destabilized, as illustrated by the image below


The image on the right, from the Naval Research Laboratory, shows sea ice speed and drift as forecast on September 5, 2015, for September 6, 2015. 

The situation looks set to get worse. Warm oceans increase the chance that strong winds will emerge that can have a devastating impact on the remaining sea ice in the Arctic.

As the September 7, 2015, image below right shows, cyclones are lining up in the Pacific Ocean, with their strongest impact yet to hit the Arctic Ocean. 

There still is some time to go before sea ice can be expected to reach its minimum, at around half September 2015, while sea currents will continue to carry warmer water into the Arctic Ocean for months to come.

There is a strengthening El Niño, while more open water increases the chance that storms will develop that will push the last remnants of the sea ice out of the Arctic Ocean, as discussed in earlier posts such as this one. Storms can also mix warm surface waters all the way down to the seafloor, as discussed in this earlier post. Cyclones increase this danger.

These cyclones are headed in the direction of the Arctic. The Climate Reanalyzer forecast for September 14, 2015, below shows strong winds over the Pacific Ocean close to the Arctic Ocean, as well as over the Arctic Ocean and the North Atlantic.


The situation is dire and calls for comprehensive and effective action, as discussed in the Climate Plan.


Sea surface temperature anomalies in the Arctic as at September 6, 2015. From 'Arctic Sea Ice Collapse Threatens -...
Posted by Sam Carana on Monday, September 7, 2015

Saturday, September 5, 2015

Methane Monster II ~ Demise of the Arctic


Presentation by Jennifer Hynes on runaway feedbacks in the Arctic and the resulting threat of near-term human extinction. At https://www.youtube.com/watch?v=7zUUZAomj6E


There are links to the transcript and to the complete set of slides of the presentation at Jennifer Hynes' blog.

In case you are looking for the earlier presentation by Jennifer Hynes, called 'The Arctic Methane Monster's Rapid Rise', it's at youtube.com/watch?v=a9PshoYtoxo and is also displayed below.


Thursday, September 3, 2015

As 2015 smashes temperature records, it's hotter than you think


by David Spratt

Spanish version

There is an El Niño in full swing which helps push average global temperatures higher, and records are being broken, but just how hot is it? For several years, we have heard that global warming has pushed temperatures higher by around 0.8 to 0.85 degrees Celsius (°C).

But in 2015, that number is not even close.

Even before this year's strong El Niño developed, 2015 was a hot year. The first few months of the year broken records for the hottest corresponding period in previous years all the way back to the start of the instrumental record in 1880. Each month, new records fell.


With the July data in, NOAA, the US Government's National Oceanic and Atmospheric Administration, reported that July was the hottest month among the 1627 months on record since 1880, and the first seven months of the year was the hottest January-July on record:
The July average temperature across global land and ocean surfaces was 0.81°C above the 20th century average. As July is climatologically the warmest month for the year, this was also the all-time highest monthly temperature in the 1880-2015 record, at 16.61°C, surpassing the previous record set in 1998 by 0.08°C.

The July globally-averaged sea surface temperature was 0.75°C above the 20th century average. This was the highest temperature for any month in the 1880-2015 record, surpassing the previous record set in July 2014 by 0.07°C. The global value was driven by record warmth across large expanses of the Pacific and Indian Oceans.

The year-to-date temperature combined across global land and ocean surfaces was 0.85°C above the 20th century average. This was the highest for January-July in the 1880-2015 record, surpassing the previous record set in 2010 by 0.09°C.
In addition the year-to-date globally-averaged land surface temperature beat the previous record in 2007 by a whopping 0.15°C, and the year-to-date globally-averaged sea surface temperature surpassed the previous record of 2010 by 0.06°C. Every major ocean basin observed record warmth in some areas.

And, as Joe Romm has reported, "It was especially hot for the 6 billion of us up here in the northern hemisphere, where the first seven months of 2015 were a remarkable 0.3°F (0.17°C) warmer than the first seven months of any year on record — and nearly a half degree Fahrenheit warmer than any year before 2007".

El Niño may be strongest on record


So this year, records are not being broken. They are being smashed, as a strong El Niño (and perhaps the strongest on record) is set to persist through to 2016. El Niño conditions are characterised by a warm band of water across the eastern tropical Pacific Ocean and facilitate the transfer of heat from the ocean surface layer to the atmosphere and are associated with a hotter climate.

The NOAA's most recent El Niño update (Climate Prediction Center / NCEP 17 August 2015) reports that:
All multi-model averages suggest that El Niño 3.4 will be above +1.5ºC (a “strong” El Niño) during late 2015 into early 2016.
(El Niño 3.4 is the zone of longitudes 120 to 150W along the equatorial Pacific Ocean).


As the chart above illustrates, the projected strength of the El Niño (yellow line) is slightly above the previous strongest such event in 1997 (red dots).

So hot will 2015 be? The NOAA has already reported that the first seven months of the year was almost 0.1°C above the previous record. This is a huge amount in a field where changes are often measured in one-hundredths of a degree.

With a 90% chance of the El Niño persisting into 2016, it is as close as a certain bet can be that 2015 will be the hottest year on the instrumental record.

And there is probably an even-money chance that the margin will exceed 0.1°C. This would be an incredible result with scientists shocked at the margin by which records are being broken. Former NASA climate science chief James Hansen says:
We can already predict that the 2015 global temperature will exceed the prior warmest year (2014) by an unusually wide margin (~ 0.1°C), exceeding 1998 (“El Niño of the century”) even further.
And there is a good chance that 2016 will beat 2015 to become the hottest year on record.

It's hotter than you think

But much hotter has it got already? The convention is to talk about the amount of warming "above pre-industrial", that is, before the steam-and-coal industrial revolution, around 1750.

But the instrumental record used by the major agencies in the US, the UK and Japan does not start till 1880, and it is this period that is often used to provide a "pre-industrial" baseline. So when we hear that warming so far up to (the average of) the last decade as being 0.8°C or 0.85°C, it is the warming from a 1880 baseline (see light green column in figure below of 0.87°C, based on the NOAA dataset since 1880).

But the climate around 1750 and 1880 were not the same. Research using proxy data and modelling shows that between 1750 and 1880 the global average temperature increased by ~0.2°C.


 When that is added (dark green column), we find that the real warming from pre-industrial 1750 to the average of the last decade is 1.07°C. It is a shock to see that we are more than half way to the unsafe 2°C "guardrail" favoured by international policy-makers.

The warming over 1750 pre-industrial to 2014 was 1.17°C.

And for the first seven months of 2015, the margin is a staggering 1.26°C higher than the pre-industrial level. Yes, it is a strong El Niño period, and it may drop back for a short while, but 2016 could be just as hot and we may be entering a new phase of accelerated warming.

Greenhouse emissions continue to soar to record levels, and attempts to clean up and retire some of the world's dirtiest coal power plants may result in a lowering of the production of aerosols (including black-carbon soot, organic carbon, sulphates, nitrates, as well as dust from smoke, manufacturing and windstorms) which at the moment provide a temporary (~1 week) cooling of 0.8-1°C.

The leading climate researcher Michael E. Mann says that as fossil fuel use is curtailed, the aerosol cooling impact will lessen. Mann says that "if the world burns significantly less coal…we would have to limit CO2 to below roughly 405 ppm", a level we will reach in two years.

A climate emergency requiring levels of action far beyond anything that is currently perceived by policy makers? As temperatures soar to record levels and it is hotter than most people understand, you can bet on that.

Earlier posted at ClimateCodeRed.org


As 2015 smashes temperature records, it's hotter than you think | by David Spratt http://arctic-news.blogspot.com/2015/09/as-2015-smashes-temperature-records-its-hotter-than-you-think.html

Posted by Sam Carana on Thursday, September 3, 2015