What is the mechanism behind accelerated warming of the Arctic Ocean, huge abrupt methane eruptions from the seafloor of the Arctic Ocean and skyrocketing temperatures?

1. Potential for Methane Release in Arctic
Vast amounts of methane are stored in hydrates under the seafloor of the Arctic Ocean. Furthermore, vast amounts of methane in the form of free gas are contained in sediments under the seafloor of the Arctic Ocean. Thirdly, vast amounts of carbon are frozen in the permafrost and much may enter the atmosphere in the form of methane as the permafrost continues to thaw.
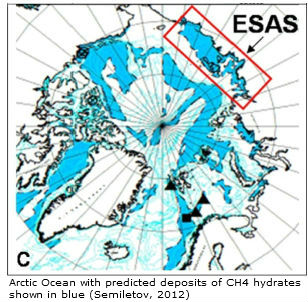 Natalia Shakhova et al. in 2010 estimated the accumulated potential for the East Siberian Arctic Shelf (ESAS) region alone (image on the right) as follows:
- organic carbon in permafrost of about 500 Gt
- about 1000 Gt in hydrate deposits
- about 700 Gt in free gas beneath the gas hydrate stability zone.
In early 2014, Sam Carana estimated annual methane emissions from hydrates and permafrost at 100 Tg (i.e. 0.1 Gt). This methane will contribute to further warming of the air over the Arctic and the North Atlantic, causing further extreme weather events, such as heatwaves and storms along the path of the Gulf Stream from the North Atlantic into the Arctic Ocean, in turn triggering further releases from hydrates at the seafloor of the Arctic Ocean and threatening to escalate into runaway global warming.
 |
| [ See: How much time is there left to act? ] |
2. Ocean Heat
As the image below shows, the July data for sea surface temperature anomalies on the Northern Hemisphere contain a trendline pointing at a rise of 2°C (3.6°F) before the year 2030. In other words, if this trend continues, the sea surface will be 2°C (3.6°F) warmer in less than 15 years time from now.
 |
| [ click on image to enlarge ] |
 |
| [ click on image to enlarge, from: The Great Unraveling ] |

The North Atlantic is warming rapidly, with sea surface temperatures as high as 22.2°C (71.96°F) recorded east of North America on April 11, 2015, a 12.6°C (22.68°F) anomaly, at a location marked by the green circle on above image.
A warmer North Atlantic is a major contributor to the rapidly warming waters of the Arctic Ocean, since the Gulf Stream keeps carrying warmer water into the Arctic Ocean all year long.
Ocean heat is carried by the Gulf Stream from Florida via the North Atlantic into the Arctic Ocean. The huge amounts of energy entering the oceans translate into higher temperatures of the water and of the air over the water, as well as higher waves and stronger winds.
 |
The image below shows sea surface temperatures on August 22, 2015, indicating that a huge amount of ocean heat has accumulated in the Atlantic Ocean off the coast of North America.


The image below shows that on September 1, 2014, a sea surface temperature of 17.5°C (63.5°F) was recorded at a location near Svalbard (green circle, co-ordinates in the black panel on the left), a 11.9°C (21.42°F) anomaly.

 As the bottom part of above image shows, sea surface temperatures around that location were substantially colder, indicating that this 17.5°C surface temperature was caused by ocean heat reaching that location from underneath the sea surface. In other words, subsurface temperatures of the water carried along by the Gulf Stream can be substantially higher than temperatures of the water at the surface, and this can be the case for the water all the way from the coast of North America to the Arctic Ocean.
Warm water carried by the Gulf Stream underneath the ocean surface will come to the surface where the sea is rather shallow. This appears to be confirmed by the image on the left, showing the situation on August 25, 2015, when sea surface temperatures near Svalbard were recorded as high as 17.3°C (63.1°F), as marked by the green circle, a 12.1°C (21.8°F) anomaly.
 The Gulf Stream keeps pushing much of this very warm water north, into the Arctic Ocean, where it threatens to unleash huge methane eruptions from the Arctic Ocean seafloor.
A further contributor is a warmer North Pacific. The image on the right shows very high sea surface temperature anomalies around North America. On August 23, 2015, sea surface temperature anomalies as high as 6.4°C (11.5°F) were recorded in the Bering Strait, at a location marked by the green circle. This is where warm waters from the Pacific Ocean are flowing into the Arctic Ocean.
Further contributions come from the combined impact of numerous feedbacks, in particular changing winds and currents, cryosphere changes and methane releases, as further described below.
3. Feedbacks: Changing Winds and Currents, Cryosphere Changes and Methane
- Changing Winds and Currents
Emissions by people are not only causing temperatures of the atmosphere and oceans to rise, they are also causing winds and ocean currents to change. Such changes can in turn result in heatwaves that are more intense and that persist for prolonged periods. Furthermore, strong northbound winds, combined with strong precipitation and waves can speed up the volume of warm water carried by Gulf Stream into the Arctic Ocean, as discussed in the post Watch where the wind blows. The image below shows waves higher than 10 m (33 ft) near Svalbard close to the edge of the sea ice on March 16, 2015 (green circle).
 |
| [ click on image to enlarge, from: Strong Winds And Waves Batter Arctic Sea Ice ] |
The Climate Reanalyzer forecast for September 8, 2015, below shows typhoons in the Pacific Ocean close to the Arctic Ocean, as well as strong wind over the Arctic Ocean.
The image below shows wind on September 9, 2015, at three levels, i.e. surface level (left), at 700 hPs (center) and at 250 hPa (right).
- Cryosphere changes
 |
| [ click on images to enlarge, from: Arctic Sea Ice Collapse Threatens - Update 7 ] |
 |
| Global warming affects wind in multiple ways, i.e. more intense cyclones and changing jet stream |
- Cryosphere changes
A warming atmosphere, warming oceans and decline of the Arctic snow and ice cover all go hand in hand. While the IPCC concluded in AR5 that, for RCP8.5, the Arctic Ocean will likely be nearly ice-free in September before mid-century, Professor Peter Wadhams warned, back in 2012, that the Arctic Ocean could be virtually ice-free within a few years.
Sunlight that previously went into melting the sea ice, as well as sunlight that was previously reflected back into space by sea ice, would be absorbed by the Arctic Ocean instead. In other words, we can expect massive warming. In the above post, Prof. Peter Wadhams warned that warming due to Arctic snow and ice loss may well exceed 2 W per square m, i.e. it could more than double the net warming causing by all emissions by all people of the world.
 |
| Professor Peter Wadhams on albedo changes in the Arctic |


Thawing of the permafrost will similarly result in albedo changes, while much of the carbon that is contained in the permafrost can be expected to be released in the form of methane or carbon dioxide as the permafrost continues to thaw. The image below pictures permafrost decline as foreseen by the IPCC in AR5.
Obviously, rapid decline of the sea ice, permafrost thawing and melting on Greenland will come with albedo changes.
 Such albedo changes will in turn make the permafrost decline more strongly and more rapidly than foreseen by the IPCC, while this will also cause more rapid temperature rises in the Arctic and ever more extreme weather events.
The image on the right shows the decline over the years of the snow cover on the Northern Hemisphere in June, through to the year 2015.
One of the dangers of this decline of the snow cover on the Northern Hemisphere is that rapid melting will cause huge amounts of warmer water to flow from rivers into the Arctic Ocean, as further discussed below.
Obviously, rapid decline of the sea ice, permafrost thawing and melting on Greenland will come with albedo changes.

The image on the right shows the decline over the years of the snow cover on the Northern Hemisphere in June, through to the year 2015.
One of the dangers of this decline of the snow cover on the Northern Hemisphere is that rapid melting will cause huge amounts of warmer water to flow from rivers into the Arctic Ocean, as further discussed below.
- Warmer Water From Rivers
More sunlight getting absorbed in the Arctic will accelerate warming of the Arctic Ocean directly, while there will also be warmer water flowing into the Arctic Ocean from rivers in Siberia and North America, fueled by stronger and longer heatwaves, storms and wildfires.
More sunlight getting absorbed in the Arctic will accelerate warming of the Arctic Ocean directly, while there will also be warmer water flowing into the Arctic Ocean from rivers in Siberia and North America, fueled by stronger and longer heatwaves, storms and wildfires.
 |
| map from: http://en.wikipedia.org/wiki/File:Rs-map.png |

 |
| [ click on images to enlarge ] |

As the image on the right shows, sea surface temperatures in the Bering Strait were as high as 20.5°C (69.1°F) on August 4, 2015.
As warm water flows through the Bering Strait into the Arctic Ocean, it dives under the sea ice and becomes harder to detect by satellites that typically measure water temperatures at the surface, rather than below the surface.
Another area of concern, marked by the bottom purple oval in the image below, is located in the north of Canada, as was evident back in February 2015.

The image below shows sea surface temperature anomalies in the Arctic on September 6, 2015.

More extreme weather events include heat waves, storms, floods and wildfires, all of which can contribute to more rapid warming of the Arctic Ocean.


In September, Arctic sea ice is at its annual minimum, threatening multiple feedbacks to combine. As described above, the temperature of the water can be even higher below the surface than at the surface. Less sea ice and warmer oceans mean that there will be more opportunities for strong storms to develop that can mix ocean heat all the down to the seafloor of the Arctic Ocean.
The combined effect of all the above will be that methane that is now contained in the form of free gas and hydrates in sediments under the Arctic Ocean, can be expected to be increasingly released as the Arctic Ocean warms further.
- Methane
Of the vast amounts of methane stored in the Arctic, much of it is prone to be released with further temperature rises, as discussed in this earlier post and in this earlier post. Cracks in sediments used to be filled with ice. Warmer water is now melting the ice that used to sit in cracks. This ice has until now acted as a glue, holding the sediment together. Moreover, the ice in the cracks has until now acted as a barrier, a seal, that prevented the methane contained in those sediments from escaping. In a video interview with Nick Breeze, Natalia Shakhova mentions a sample of sediment taken from the ESAS seafloor in 2011 that turned out to be ice-free to a depth of 53 m at water temperatures varying from -0.6˚C to -1.3˚C. Back in 2008, Natalia Shakhova et al. considered release of up to 50 Gt of predicted amount of hydrate storage as highly possible for abrupt release at any time.
 |
| Conclusion from a paper presented at the 2008 EGU conference, on background of a frame from a video interview by Nick Breeze with Natalia Shakhova. |


All these feedbacks can interact and amplify each other in non-linear ways, resulting in rapid and intense temperature rises, as illustrated by the image below.
 |
| [ Diagram of Doom, from: Near-Term Human Extinction - for more background, also see Feedbacks ] |
4. Collapse of Civilization
As discussed back in 2011, much of the soot from firestorms in Siberia could settle on the ice in the Himalaya Tibetan plateau, melting the glaciers there and causing short-term flooding followed by rapid decrease of the flow of ten of Asia’s largest river systems that originate there, with more than a billion people’s livelihoods depending on the continued flow of this water.
The threat is that such rapid temperature rises will appear at first in hotspots over the Arctic and eventually around the globe, while also resulting in huge temperature swings that could result in further crop loss and depletion of supply of food and fresh water. As discussed in the 2007 post Ten Dangers of Global Warming, food supply could come under threat worldwide, with much industrial activity coming to a halt.
Note that less industrial activity will not result in an immediate fall in temperatures. Instead, it would make that the aerosols that are currently sent up in the air by burning fuel and that are currently masking the full wrath of global warming, will fall out of the air in a matter of weeks. Until now, about half of the global temperature rise is suppressed by such aerosols. Stopping aerosols release overnight could make temperatures rise abruptly by 1.2°C (2.16°F) in a matter of weeks.
 |
| [ from: 2015 without Arctic sea ice ] |
Meanwhile, the carbon dioxide that is emitted now will take ten years to reach its peak impact, so we're still awaiting the full wrath of carbon dioxide emitted over the past decade. A recent study calculates that global mean surface temperature may increase by 0.5 °C after carbon emissions are stopped at 2°C global warming, and will have decreased only minimally from that level after 10,000 years. For those who thought that the world was at a comfortable distance from the 2°C "guardrail", remember that for the first seven months of 2015, global average temperature was already 1.26°C higher than the pre-industrial level.
5. Runaway Global Warming
 |
| [ click on image to enlarge, from: Methane Levels Early 2015 ] |
Post by Sam Carana.
The Russians might want big engineering project the big rivers flowing into the arctic ocean to keep it from turning less salty which would screw up the thermohhaline adding to fresh water from melting polar ice. This is my idea! maybe I'm the first to think of it. The artificial lakes can be tapped and diverted to dryer parts of Asia and Europe for irrigation and and other uses.
ReplyDeleteThis the type of giant engineering the Russians were so gung ho on during the soviet era.
Hello Sam
ReplyDeleteI dont know if you saw this New Study — Risk of Significant Methane Release From East Siberian Arctic Shelf Still Growing
Robert Scribblers article : http://robertscribbler.com/2015/09/10/new-study-risk-of-significant-methane-release-from-east-siberian-arctic-shelf-still-growing/
Recent study by the now famous Semiletov and Shakhova team
http://rsta.royalsocietypublishing.org/content/373/2052/20140451
I also read a study a week or so ago that said the decarbonizing the atmosphere wouldn't do anything to help the ocean acidity issue.
I should somehow keep track of all the studies I come across...
Thanks for this excellent article.